Overview of CISNET modeling
Simulation Modeling | Preclinical Natural History of Cancer | Model Inputs and Outputs | Counterfactuals | Comparative ModelingSimulation Modeling
In the Cancer Intervention and Surveillance Modeling Network (CISNET), investigators develop flexible broad-based disease models that incorporate a central module of cancer natural history. Most CISNET models use microsimulation. In a microsimulation model, a large number of persons are simulated and followed throughout their individual lifetimes. A person’s life history may include events such as year of birth, accumulation of risk factors for cancer, age at development of preclinical cancer, ages at cancer progression landmarks and metastatic spread, diagnosis of cancer (through screening or symptomatic presentation), treatment of cancer, and death from cancer or other causes. By tallying outcomes across individuals, the models can gain insight into underlying dynamics in risk factors and cancer interventions in both historical populations and hypothetical scenarios.
Preclinical Natural History of Cancer
Because the preclinical natural history of cancer is largely unknown (since latent cancer is unobservable and detected cancer is generally treated), it can only be inferred using indirect evidence. Each CISNET model makes different assumptions about the process of carcinogenesis based on data from autopsy studies; prevention, screening, and treatment trials; cohort studies; cancer registries; and other types of studies. The assumed processes are nearly always parameterized, and model parameters are estimated using empirical data inputs and statistical algorithms.
Model Inputs and Outputs
Inputs to the models can include population demographics (e.g., age, gender, and racial composition), the full range of cancer control interventions (e.g., new screening modalities and treatment regimens), and observed cancer outcomes (e.g., cancer incidence or mortality observed in a clinical trial or population registry). The modeled setting may be for a single hypothetical cohort or a range of birth cohorts of the U.S. population. This latter setting captures a range of birth cohorts and possibly changing risk factor profiles, screening behaviors, and treatments used by each cohort as it ages. After estimating model parameters using observed data on cancer outcomes, the model can be used to study the impacts of interventions in the actual U.S. population. Recent developments have shown that multi-cohort cost-effectiveness models have advantages over single hypothetical cohorts in representing actual population dynamics over time. Outputs can include the full range of the benefits and costs of the interventions. A general formulation of CISNET model inputs and outputs is illustrated in Figure 1.
General Formulation of CISNET Model Inputs and Outputs
Figure 1: General formulation of CISNET model inputs and outputs.
Figure 2 demonstrates a specific example in which the adenoma-carcinoma natural history sequence of colorectal cancer is modeled. Risk factors can modify the onset and progression rates of adenomas, screening detects (and potentially removes) pre-cancerous lesions and pre-clinical cancer, and treatment alters post-diagnosis survival rates. Flexible models of this type can be easily adapted to incorporate new technologies as they are developed. For example, when CT colonography (sometimes known as virtual colonoscopy) became a viable alternative to optical colonoscopy, CISNET models were adapted to evaluate this new technology.
Colorectal Microsimulation
Figure 2: Example of a colorectal microsimulation model, including a natural history module that can be altered by interventions.
Counterfactuals
One advantage of simulating individual life histories is that the models can simulate a range of cancer outcomes for the same person under alternative scenarios (i.e., counterfactuals). The top part of Figure 3 shows the life history of one simulated individual when no screening occurs. At birth, this person is free of any diseases. However, a small cancerous tumor develops at some point—this represents the onset of cancer. At first, this cancer may not cause any symptoms and the person may be unaware that he or she has cancer. In the upper panel (without screening), the cancer progresses further and eventually causes symptoms, for example due to metastases, leading to a clinical diagnosis. In this case, the person eventually dies due to the cancer..
The lower panel (with screening) shows the life history of the same simulated individual. If the person attends screenings, the cancer may be detected at an earlier point when curative treatment has a higher chance of success. In this example, death due to cancer is prevented and the person’s life is prolonged due to the earlier detection and successful treatment of the cancer: he or she dies at a later date from causes other than cancer.
However, many scenarios are possible. For example, a person’s cancer may be missed by screening, a cancer may be detected earlier but not successfully treated, or a cancer that would not have caused symptoms may be detected, leading to overdiagnosis and potentially unnecessary treatments. The CISNET models take all of these possibilities into account to investigate the effects of cancer screening programs.
Download a PDF of this diagram.
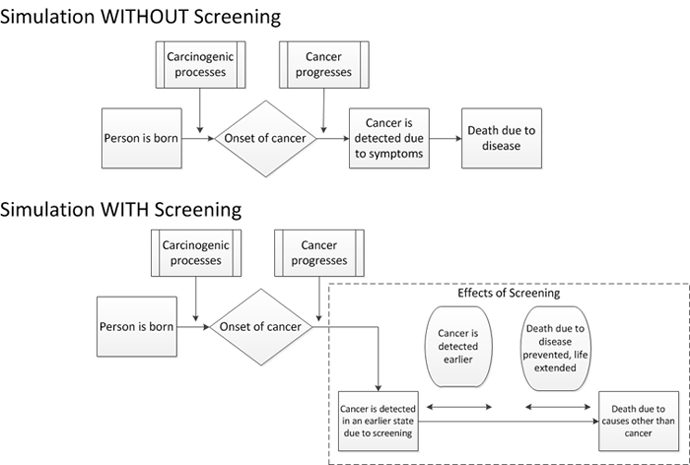
Figure 3: Example of a generic microsimulation model with and without a screening intervention.
Comparative Modeling
Because the natural history of cancer and the impact of interventions (i.e., prevention, screening, and treatment) on natural history must be indirectly inferred from partially observed processes, different models may produce different results. A comparative modeling approach utilized by CISNET explores differences between models in a systematic way. In joint collaborations, a set of common model inputs is shared and a set of common intermediate and final outputs are developed. Results are then compared across models and the sources of any differences are carefully investigated.
Comparative modeling produces a range of results across models and, when consensus can be reached, greatly enhances the credibility of modeling results by highlighting their reproducibility. When results are disparate, it can help to pinpoint areas where our knowledge base is insufficient and further research is needed. Comparative modeling is a powerful tool that would be impossible without a similar large-scale collaborative effort within the scientific community.